This Notebook is an educational collection of data and process visualization setups that can work both as an educational example and as a base template for further developments in visualizations.
Contents (Based on Method)
- Processes & Algorithms
- Interactive
- Locative
- 3-Dimensional
- XR (VR, AR, MR)
Contents (Based on Platform)
- JavaScript
- D3
- Three.js
- MapBox
- Python
- MatPlotLib
- Plotly
- PyVista
- Houdini
- Unity
Examples
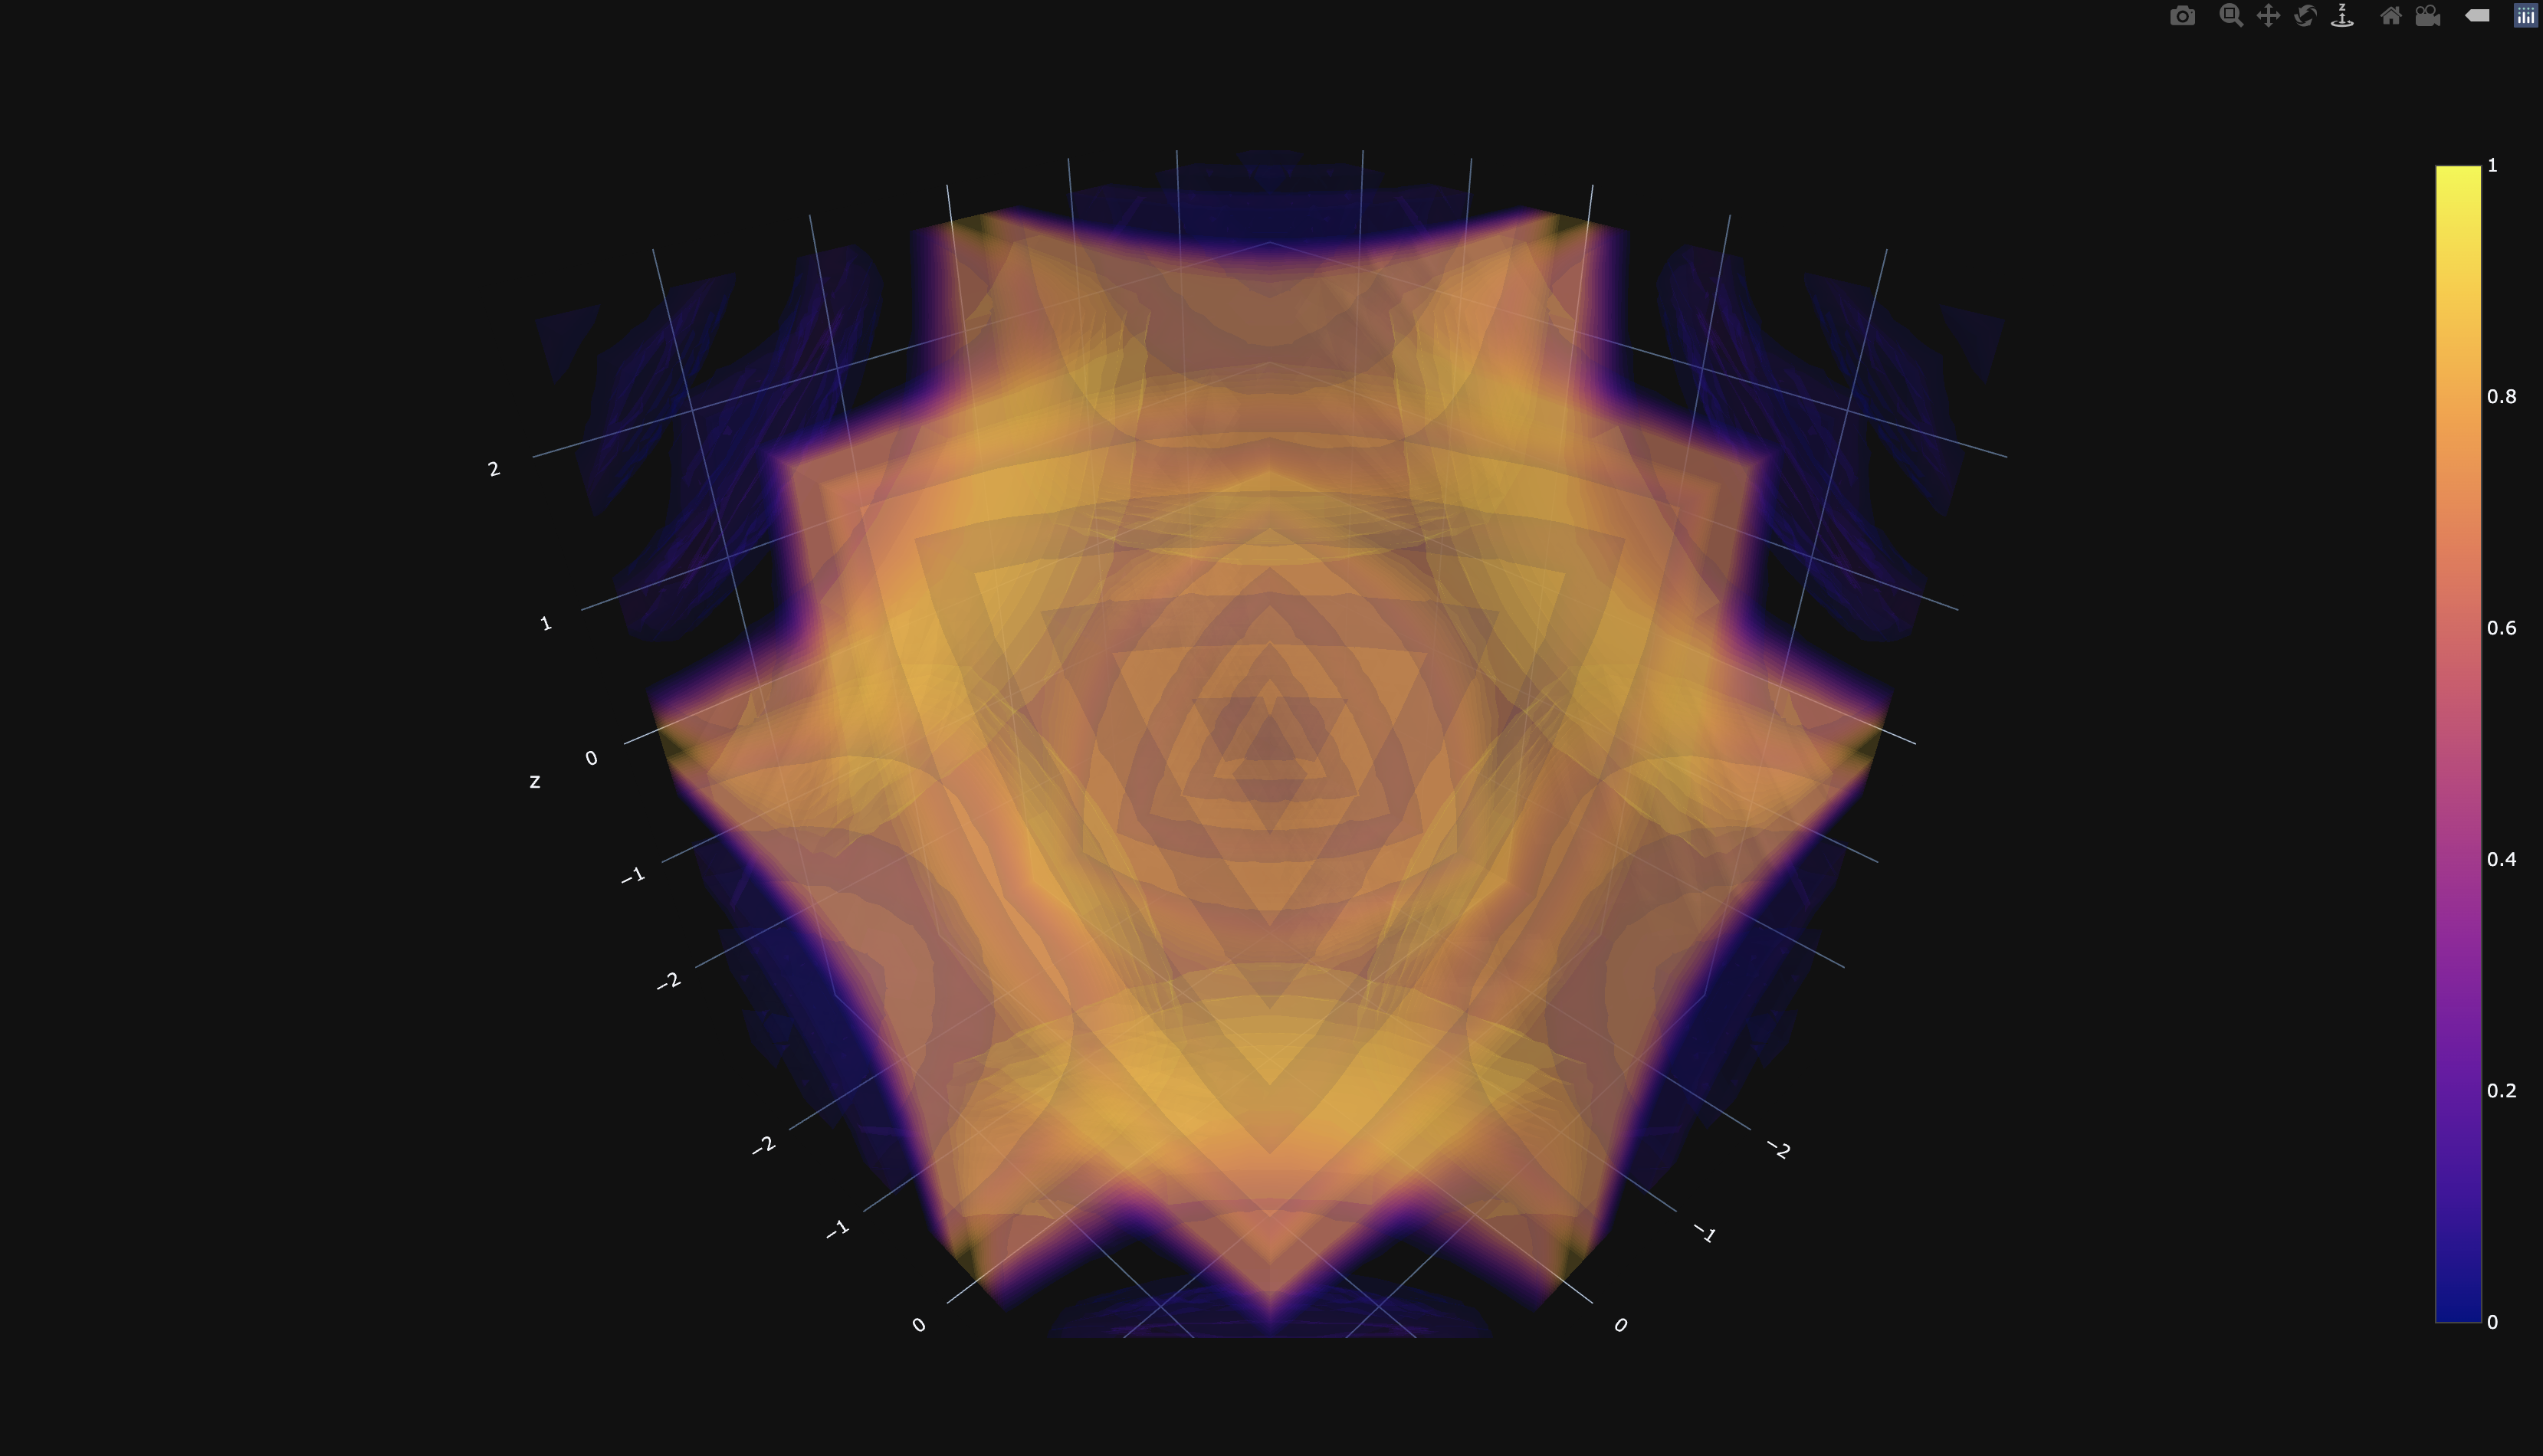
Interactive Visualization of Volumetric Data Sets
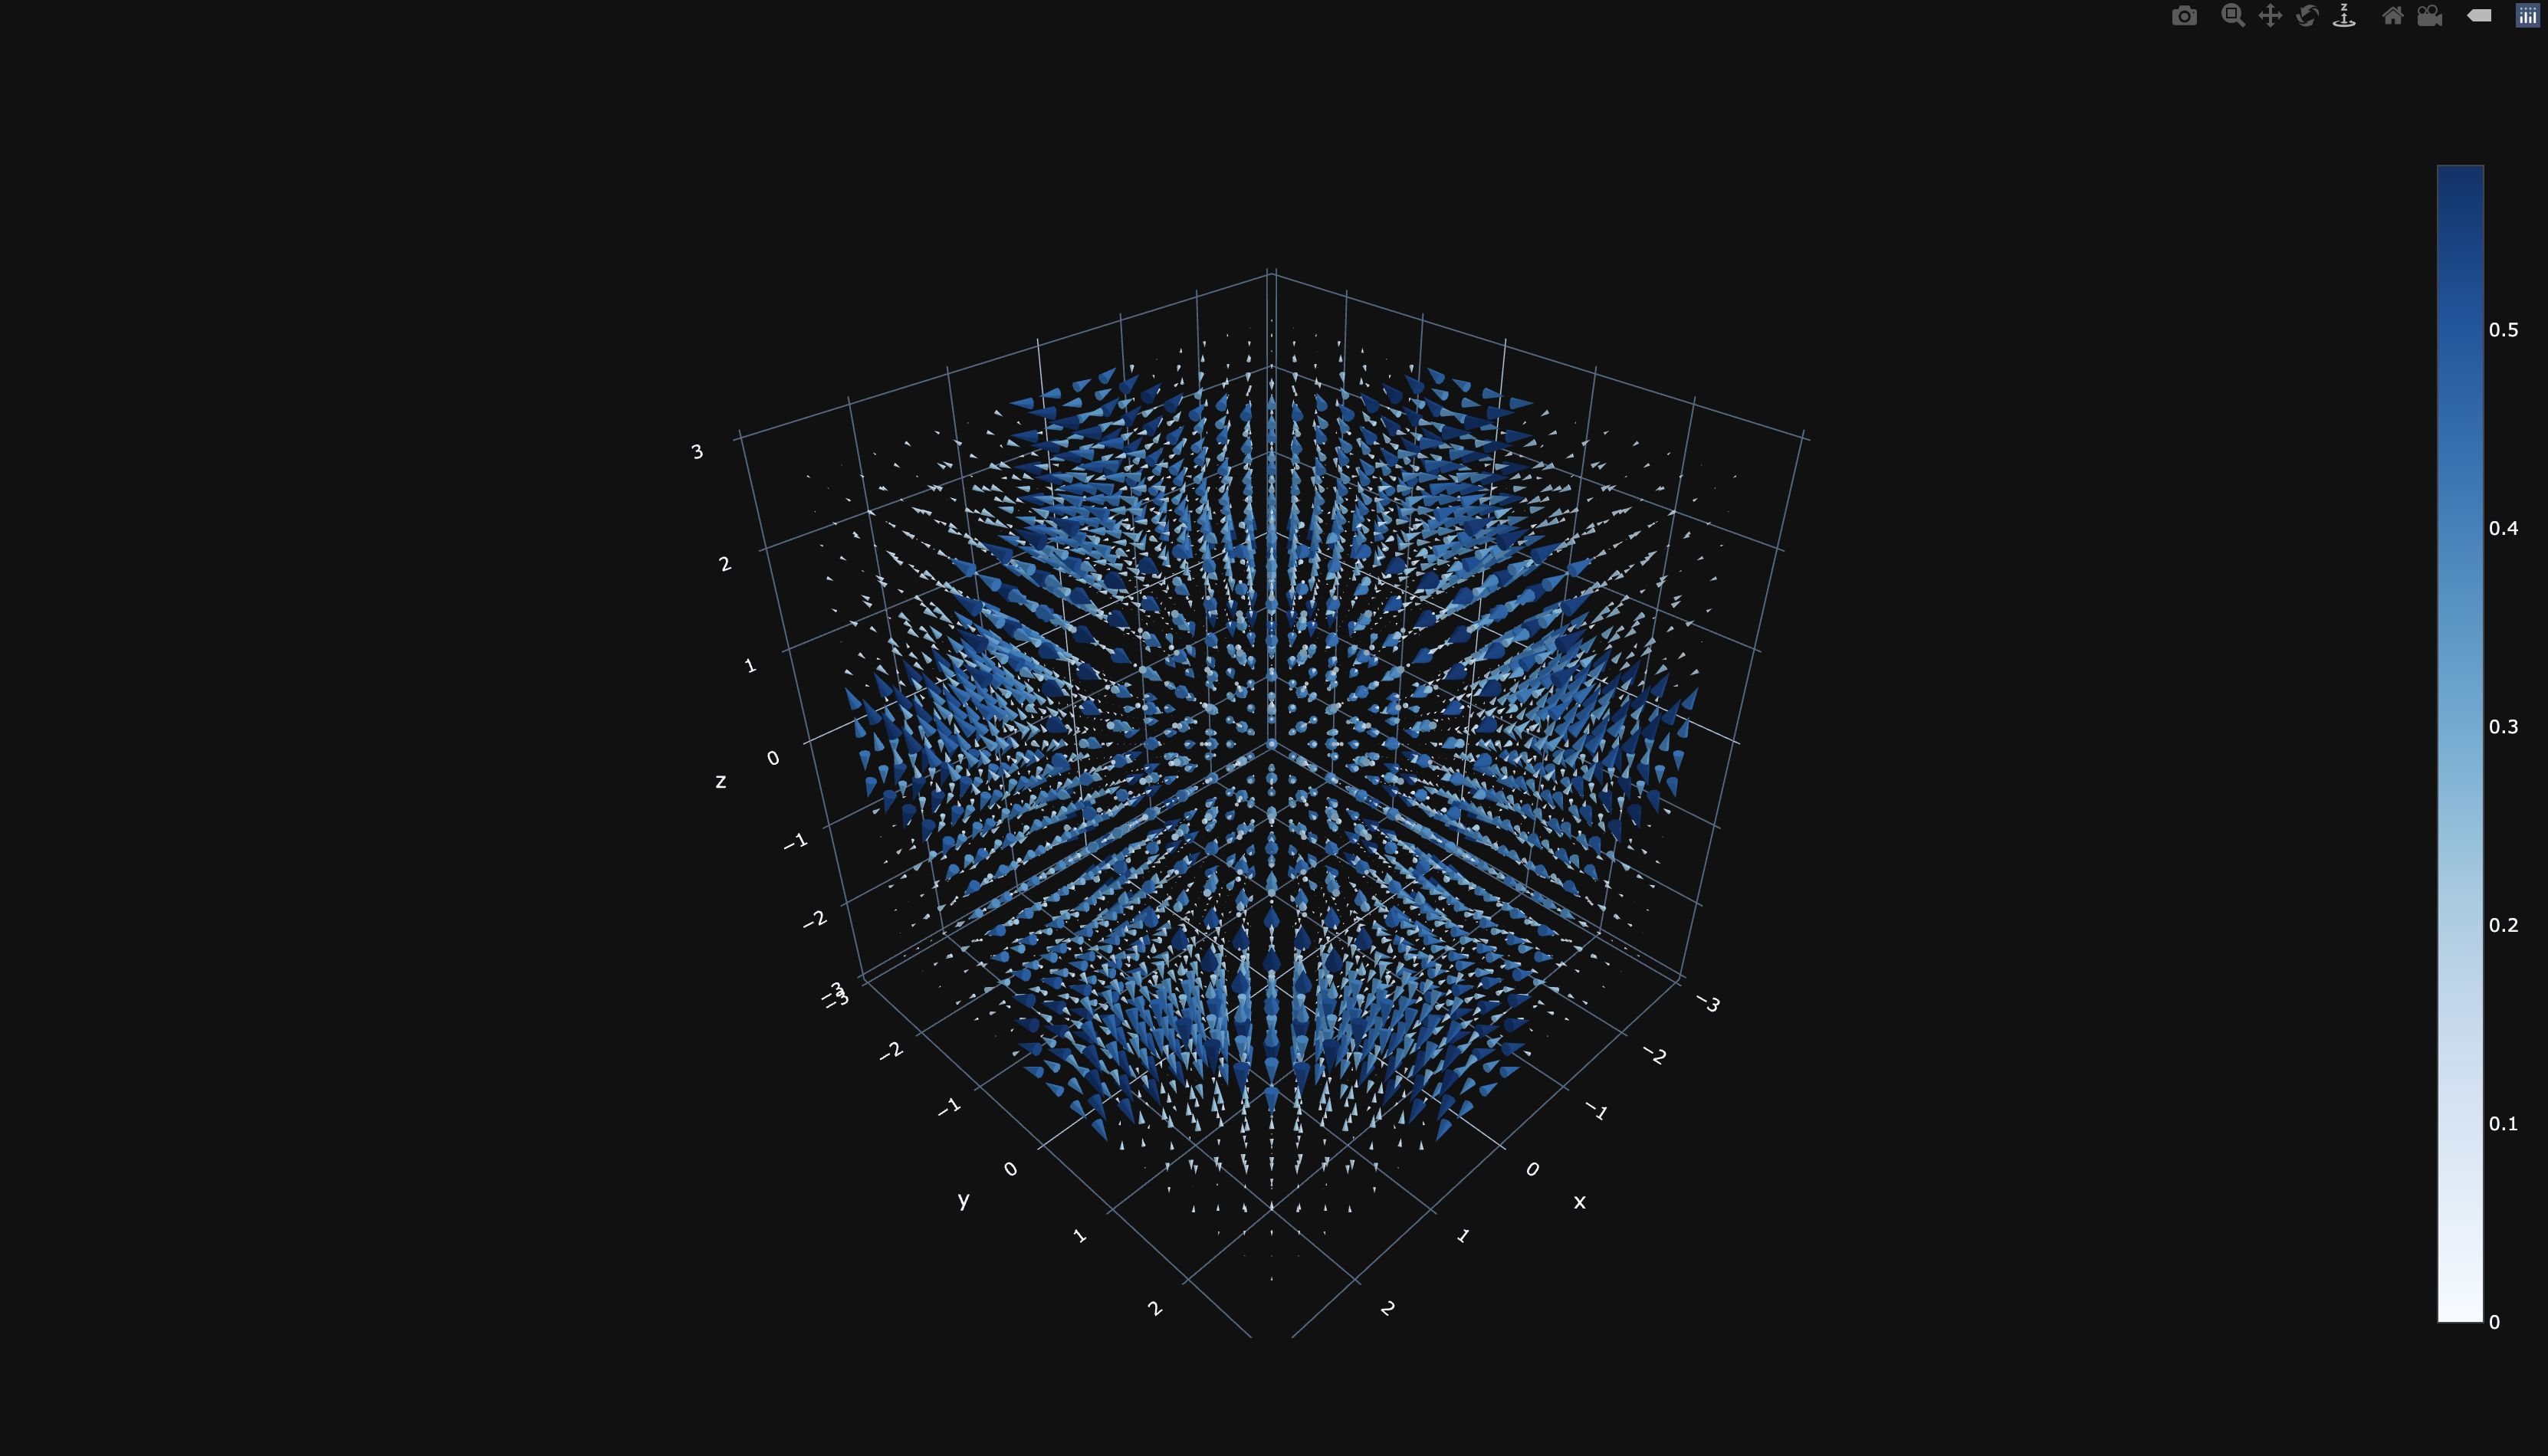
Interactive Visualization of 3D Vector Field
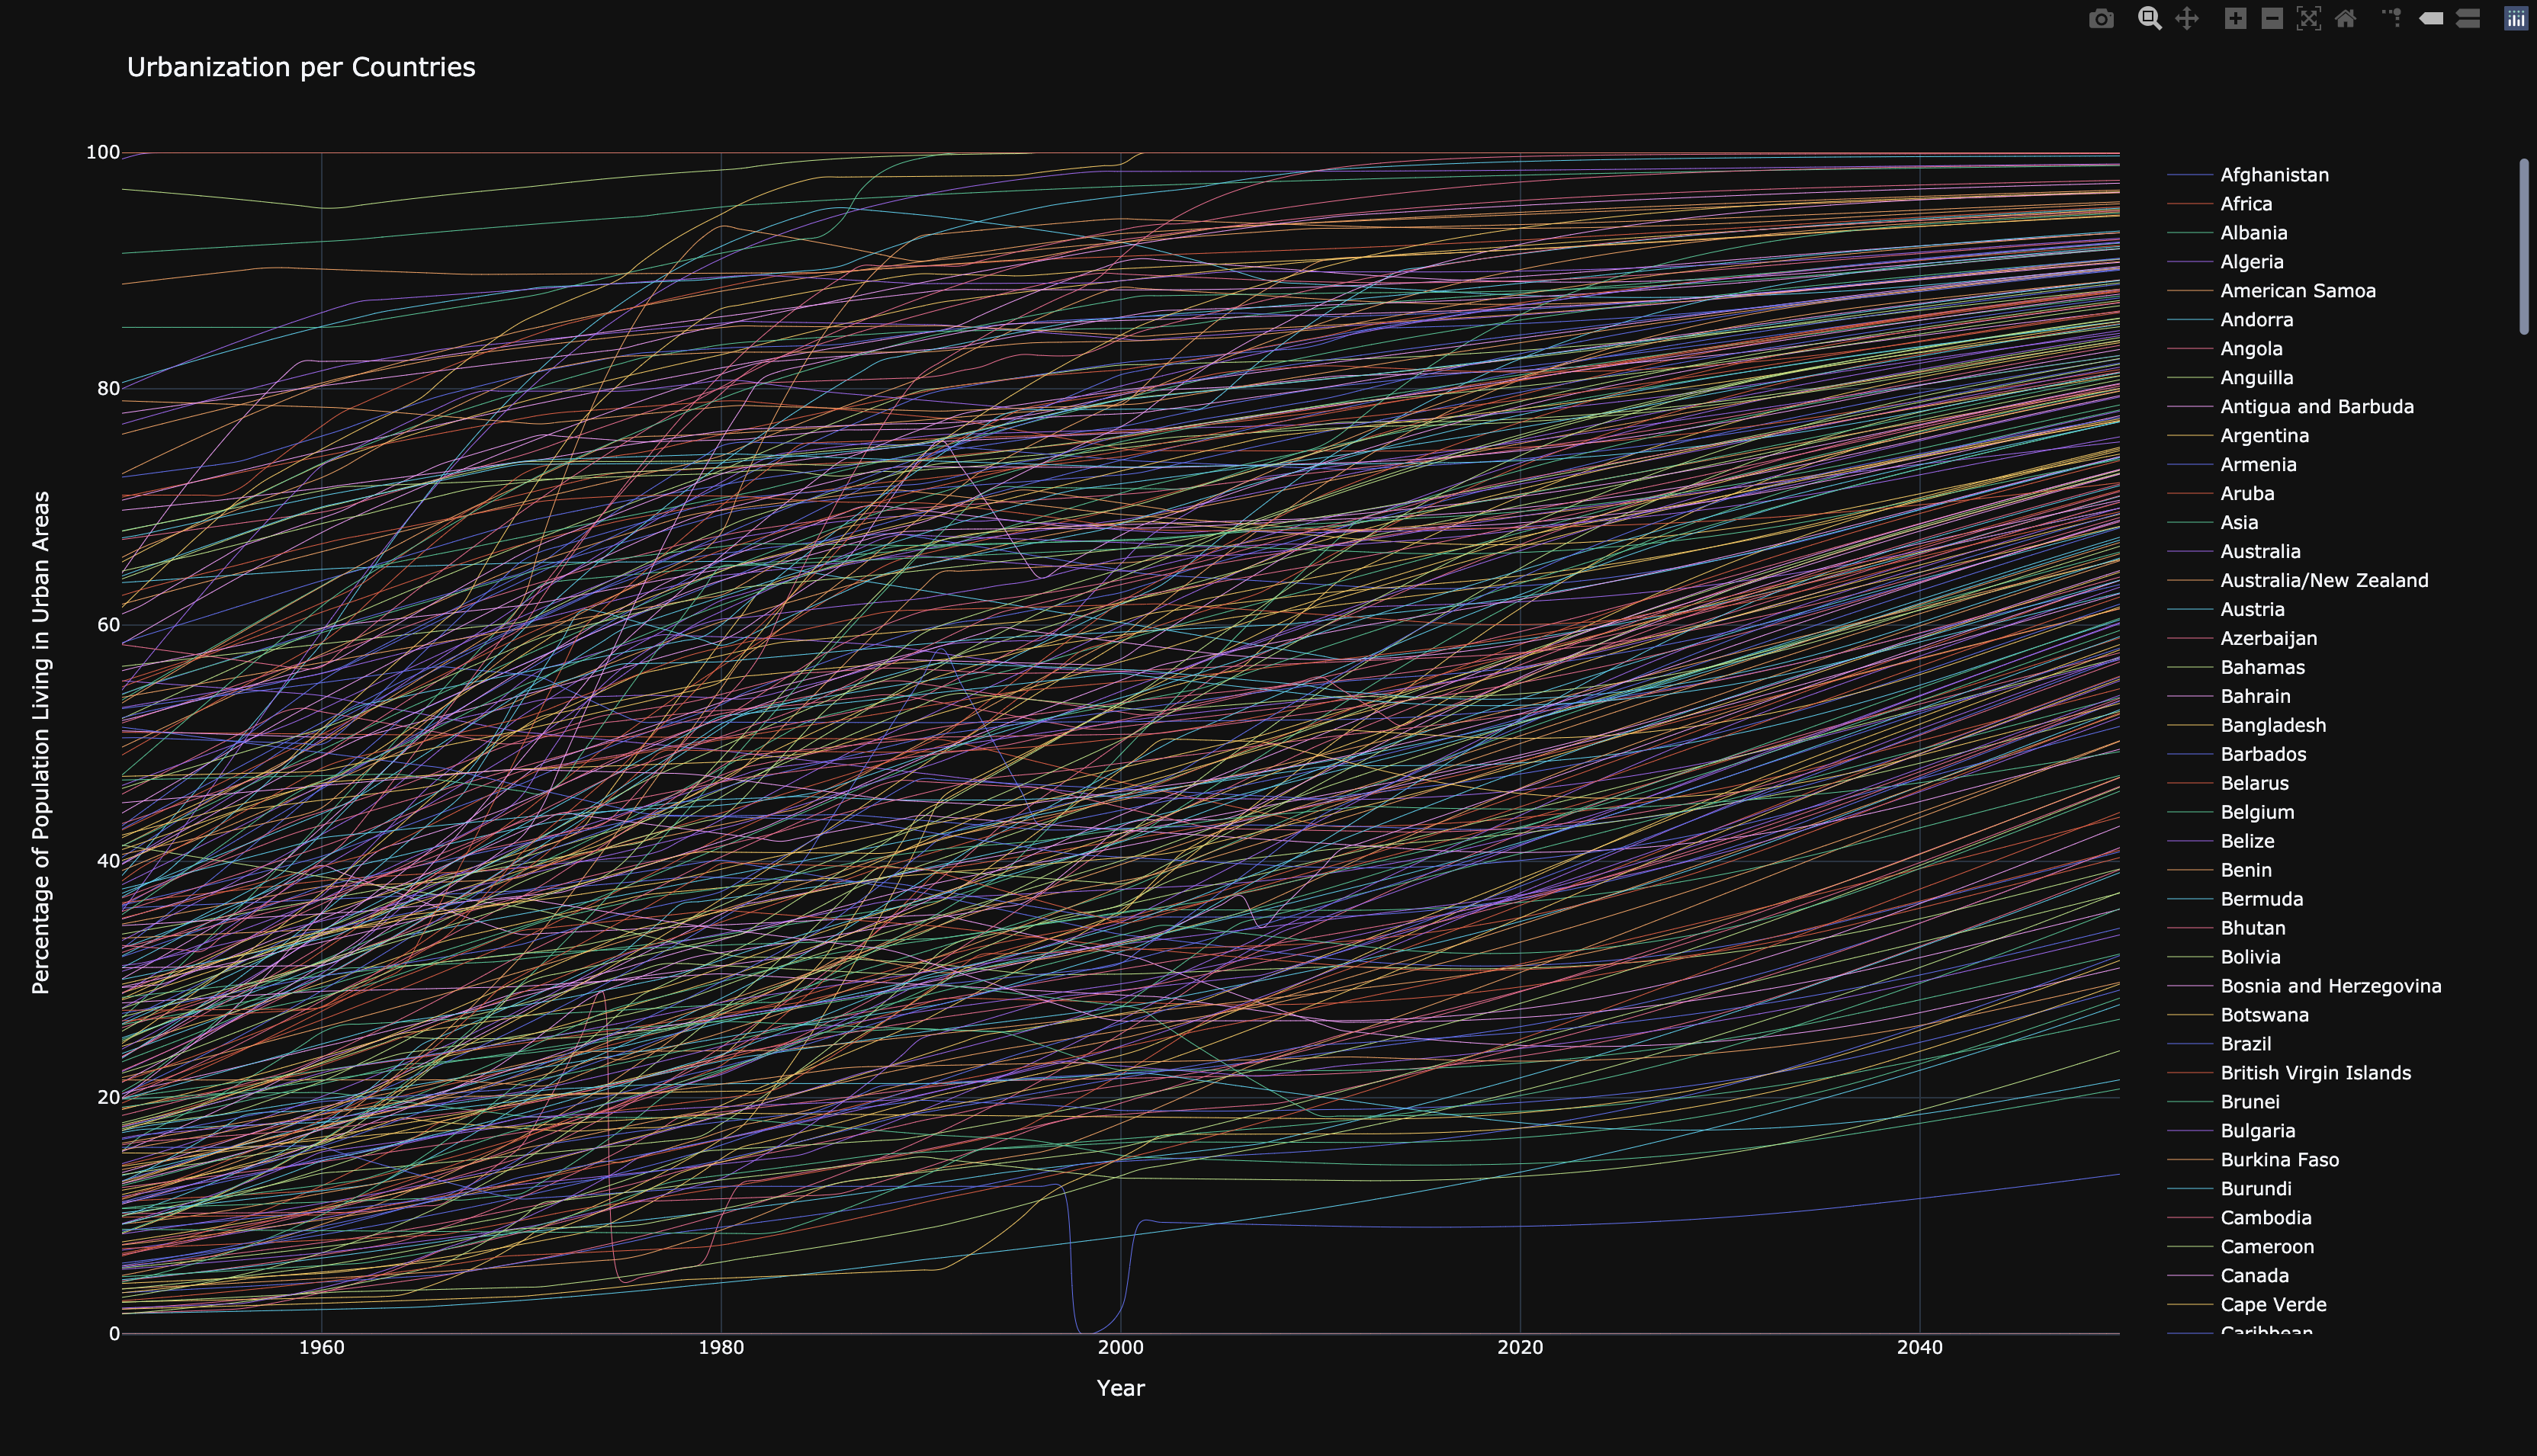
Interactive Visualization of Urbanization of World
Interactive Visualization of Mesh Rasterization Algorithm